
The Best Indicators for Beginner Forex Traders
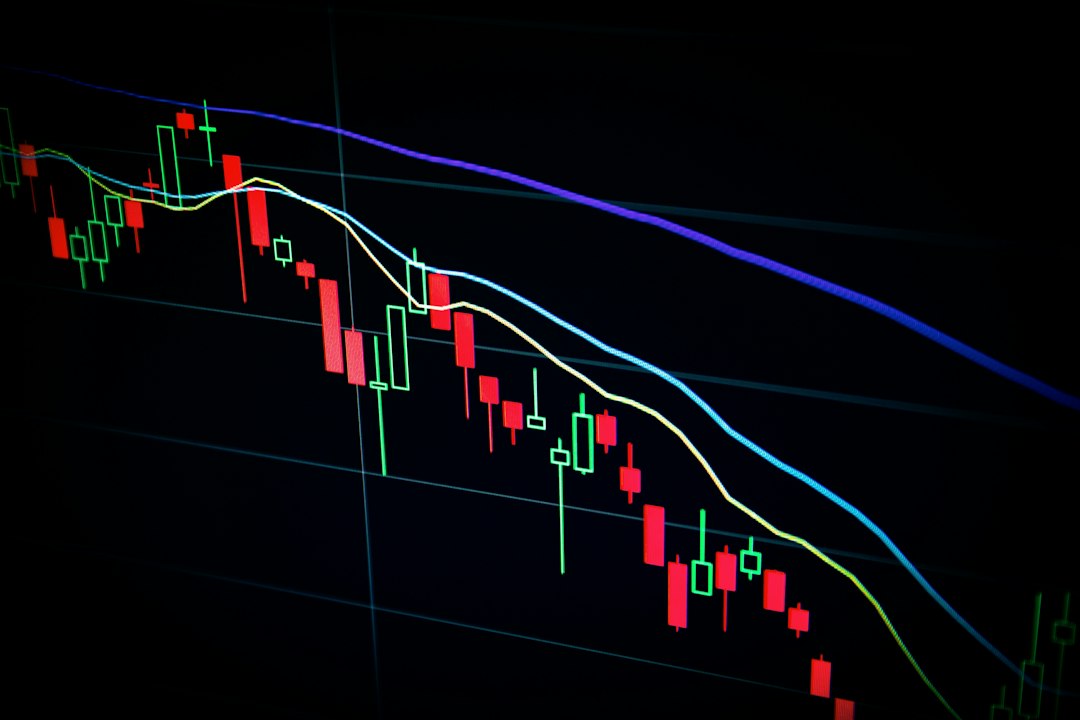
Starting your Forex trading journey can feel overwhelming with countless indicators available on trading platforms. Many beginners struggle to identify which tools provide genuine value versus creating confusion. This guide introduces the most effective and user-friendly indicators that help new traders make informed decisions without overcomplicating their analysis. You'll learn five essential indicators, how they work, and when to apply them in real trading situations.
Moving Averages: The Foundation of Trend Analysis
Moving averages are the most fundamental indicators for identifying market trends. They smooth out price data by creating a constantly updated average price over a specific period. The two most common types are the Simple Moving Average (SMA) and the Exponential Moving Average (EMA).
The 50-period and 200-period moving averages are widely watched by traders globally. When the shorter-period average crosses above the longer one (golden cross), it signals potential upward momentum. Conversely, a cross below (death cross) suggests bearish pressure. Beginners should start by plotting these two averages on daily charts to understand long-term trends before analyzing shorter timeframes.
Moving averages also act as dynamic support and resistance levels. Prices often bounce off these lines, providing entry and exit points. However, moving averages lag behind current price action, so they work best when combined with other indicators for confirmation.
Relative Strength Index (RSI): Spotting Overbought and Oversold Conditions
The Relative Strength Index measures momentum by comparing the magnitude of recent gains to recent losses. This oscillator ranges from 0 to 100, with readings above 70 indicating overbought conditions and below 30 suggesting oversold conditions.
For beginner traders, RSI provides clear visual signals when markets may reverse. When RSI reaches extreme levels, it warns that the current price movement might be exhausted. However, remember that strong trends can keep RSI in overbought or oversold territory for extended periods. The most reliable signals occur when RSI diverges from price action—when price makes new highs but RSI doesn't, or vice versa.
Use the standard 14-period RSI setting initially. This balanced timeframe works across multiple chart intervals and currency pairs. Avoid trading solely based on RSI; instead, use it to confirm signals from other indicators or price patterns.
MACD: Combining Trend and Momentum Analysis
The Moving Average Convergence Divergence (MACD) combines multiple moving averages to show both trend direction and momentum strength. It consists of three components: the MACD line, signal line, and histogram. This indicator helps traders identify potential trend changes and measure trend strength.
Trading signals occur when the MACD line crosses the signal line. A bullish crossover (MACD crossing above signal line) suggests buying opportunities, while a bearish crossover indicates potential selling points. The histogram shows the difference between these lines, with increasing bars indicating strengthening momentum.
| Indicator | Primary Function | Best Used For | Key Signal |
|---|---|---|---|
| Moving Averages | Trend identification | Direction confirmation | Crossovers |
| RSI | Momentum measurement | Reversal warnings | Overbought/oversold |
| MACD | Trend + momentum | Entry timing | Line crossovers |
| Bollinger Bands | Volatility gauge | Breakout trading | Band squeezes |
Bollinger Bands: Understanding Price Volatility
Bollinger Bands consist of three lines: a middle band (20-period SMA) and two outer bands plotted at standard deviations from the middle. These bands expand during volatile periods and contract during quiet markets, providing valuable context for price movements.
When prices touch or exceed the outer bands, they're considered extended and may reverse toward the middle band. However, during strong trends, prices can "walk the bands,