
How to Identify Forex Market Trends More Accurately
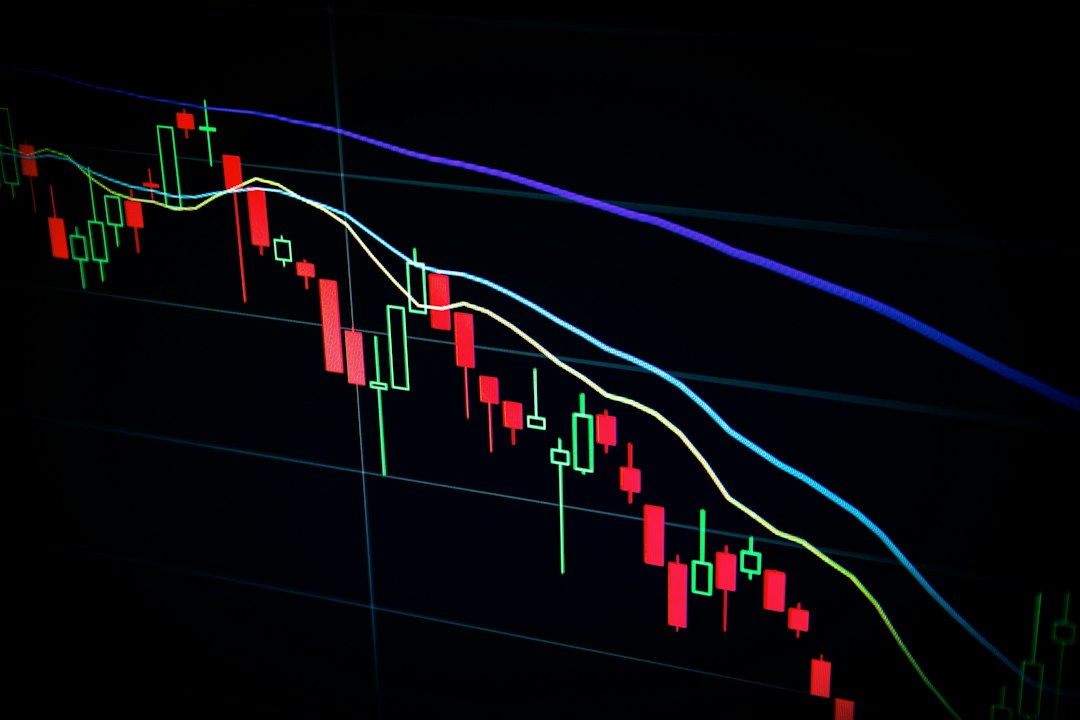
Successful Forex trading depends heavily on your ability to identify market trends accurately. Many traders, especially beginners, struggle with recognizing whether the market is trending upward, downward, or moving sideways. This confusion often leads to poor entry and exit decisions, resulting in unnecessary losses. In this guide, you'll learn practical methods to identify Forex trends using proven technical analysis tools, price action principles, and multiple timeframe analysis for more confident trading decisions.
Understanding the Three Types of Market Trends
Before identifying trends, you must understand the three fundamental market directions. An uptrend consists of higher highs and higher lows, indicating bullish momentum where buyers control the market. A downtrend shows lower highs and lower lows, revealing bearish pressure with sellers dominating. A sideways trend or range-bound market moves horizontally between support and resistance levels without clear direction. Recognizing these patterns is the foundation of trend analysis.
Many novice traders make the mistake of forcing trades in sideways markets when they should wait for clear directional movement. Understanding market structure helps you avoid trading during consolidation phases and focus your energy on high-probability trend-following opportunities.
Using Moving Averages to Confirm Trend Direction
Moving averages are among the most reliable tools for trend identification. The Simple Moving Average (SMA) and Exponential Moving Average (EMA) smooth out price fluctuations, making the underlying trend more visible. Common periods include the 50-day, 100-day, and 200-day moving averages.
| Moving Average | Period | Best Use |
|---|---|---|
| 50 EMA | Short-term | Immediate trend confirmation |
| 100 SMA | Medium-term | Swing trading signals |
| 200 SMA | Long-term | Major trend identification |
When price consistently stays above the moving average, the trend is bullish. When price remains below, the trend is bearish. The slope of the moving average also matters—a rising slope confirms uptrend strength, while a declining slope validates downtrend momentum. Using multiple moving averages together, such as the 50 and 200 EMA crossover strategy, provides stronger confirmation signals.
Applying Trendlines and Price Action Analysis
Drawing trendlines connects significant price highs or lows, visually displaying the trend's direction and strength. An uptrend line connects rising lows, while a downtrend line connects falling highs. Valid trendlines require at least two touching points, but three or more increase reliability. The more times price respects a trendline, the stronger it becomes.
Price action analysis complements trendlines by focusing on candlestick patterns and market structure. Look for patterns like higher highs in uptrends or lower lows in downtrends. Rejection wicks at trendlines often signal trend continuation, while breaks suggest potential reversals. Combining trendlines with support and resistance zones creates a complete picture of market dynamics without relying solely on indicators.
Multiple Timeframe Analysis for Trend Confirmation
One of the most effective methods to improve trend identification accuracy is multiple timeframe analysis. Start by examining the higher timeframe (daily or weekly) to understand the primary trend direction. Then drop to your trading timeframe (4-hour or 1-hour) to find precise entry points aligned with the larger trend.
For example, if the daily chart shows a strong uptrend, look for pullbacks on the 4-hour chart to enter long positions. This approach reduces false signals and increases your probability of success. Never trade against the higher timeframe trend unless you have extremely strong reversal confirmation. Many professional traders use the rule: trend on the daily, entries on the 4-hour or 1-hour charts.
Combining Indicators with Trend Analysis
While moving averages and trendlines form the core of trend identification, additional indicators provide confirmation. The Average Directional Index (ADX) measures trend strength—readings above 25 indicate a strong trend, while below 20 suggests a weak or sideways market. The MACD (Moving Average Convergence Divergence) helps identify trend momentum shifts through crossovers and histogram changes.
Remember that indicators work best when combined with price action. No single indicator guarantees accuracy. Use them as supporting tools, not standalone decision-makers. The key is developing a consistent methodology that combines trend structure, moving averages, and one or two confirming indicators that match your trading style and risk tolerance.
Conclusion: Accurate trend identification requires combining multiple analysis methods including moving averages, trendlines, price action, and multiple timeframe analysis. Practice these techniques on demo accounts before risking real capital. Consistent application of these principles will significantly improve your trading decisions and help you align with market momentum rather than fighting against it.