
How to Read Forex Charts Like a Beginner: A Complete Guide
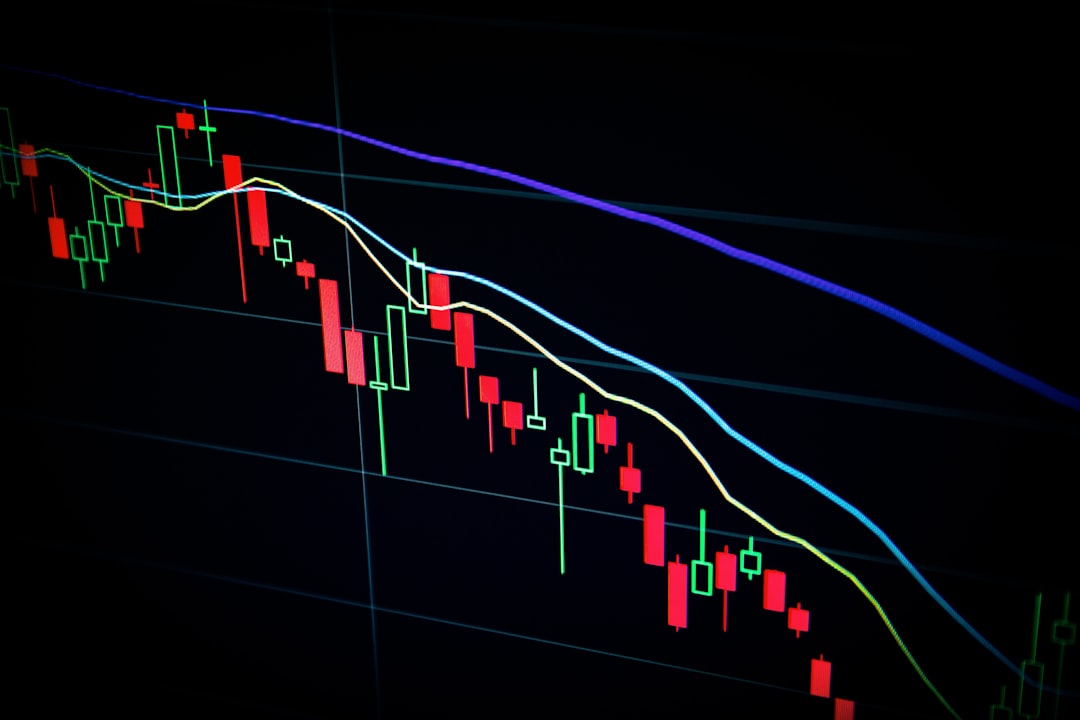
Reading Forex charts can seem intimidating when you first start trading currencies. However, understanding how to interpret price movements on charts is a fundamental skill every trader must develop. This guide will walk you through the essential elements of Forex chart reading, from basic chart types to recognizing key patterns. By the end, you'll have a solid foundation to analyze market movements and make informed trading decisions.
Understanding the Three Main Chart Types
Forex traders use three primary chart types, each offering different levels of detail. Line charts connect closing prices over time, providing a simplified view of price trends. They're excellent for spotting general market direction but lack detail on price fluctuations within each period.
Bar charts show more information: the open, high, low, and close (OHLC) for each time period. Each vertical bar represents one period, with small horizontal lines indicating opening and closing prices. Candlestick charts display the same OHLC data but in a more visual format. The rectangular body shows the opening and closing range, while thin lines (wicks or shadows) extend to the high and low prices. Green or white candles typically indicate price increases, while red or black candles show decreases.
| Chart Type | Information Shown | Best For |
|---|---|---|
| Line Chart | Closing prices only | Quick trend identification |
| Bar Chart | OHLC data per period | Detailed price analysis |
| Candlestick Chart | OHLC with visual patterns | Pattern recognition and sentiment |
Mastering Timeframes and Their Importance
Forex charts can display different timeframes, ranging from one-minute intervals to monthly views. Each timeframe serves different trading styles. Day traders often use 5-minute, 15-minute, or hourly charts to capture short-term price movements. Swing traders prefer 4-hour or daily charts to identify medium-term trends, while position traders analyze weekly and monthly charts for long-term market direction.
Understanding multiple timeframes is crucial for context. A currency pair might show an uptrend on the 15-minute chart but be in a downtrend on the daily chart. This concept, called multiple timeframe analysis, helps you align your trades with the broader market direction, reducing the risk of trading against the dominant trend.
Reading Candlestick Patterns for Market Signals
Candlestick patterns provide insights into market psychology and potential price reversals. Single candle patterns like the doji (where open and close are nearly equal) suggest market indecision. The hammer and shooting star can signal potential reversals when they appear after trends.
Multi-candle patterns offer stronger signals. The engulfing pattern occurs when a candle completely covers the previous candle's body, suggesting a momentum shift. The morning star and evening star are three-candle patterns that indicate potential trend reversals. While these patterns are helpful, always confirm them with other analysis tools like support and resistance levels or volume indicators.
Identifying Support and Resistance on Charts
Support levels are price points where buying pressure tends to prevent further declines, while resistance levels are where selling pressure stops price advances. On your chart, these appear as horizontal areas where price has repeatedly bounced or stalled.
To identify these levels, look for areas where price has reversed multiple times. The more times a level has held, the stronger it becomes. When price breaks through support, that level often becomes new resistance, and vice versa. These role reversals provide important trading opportunities. Drawing these levels on your charts helps you anticipate potential entry and exit points for your trades.
Using Chart Indicators to Confirm Your Analysis
While price action is the foundation of chart reading, technical indicators can provide additional confirmation. Moving averages smooth out price data to help identify trend direction. The Relative Strength Index (RSI) measures momentum and can indicate overbought or oversold conditions.
The MACD (Moving Average Convergence Divergence) helps identify trend changes and momentum shifts. Volume indicators show the strength behind price movements. However, avoid cluttering your charts with too many indicators. Start with one or two that complement your trading strategy, and learn to interpret them consistently before adding more tools to your analysis.
Mastering Forex chart reading takes practice and patience. Start with candlestick charts on daily timeframes to build your foundation. Practice identifying support and resistance levels, and gradually incorporate pattern recognition into your analysis. Remember, no single chart pattern or indicator guarantees success—combine multiple analysis methods and always use proper risk management. Keep a trading journal to track which chart signals work best for your strategy and continue refining your skills through consistent practice.