
What Is Technical Analysis in Forex Trading?
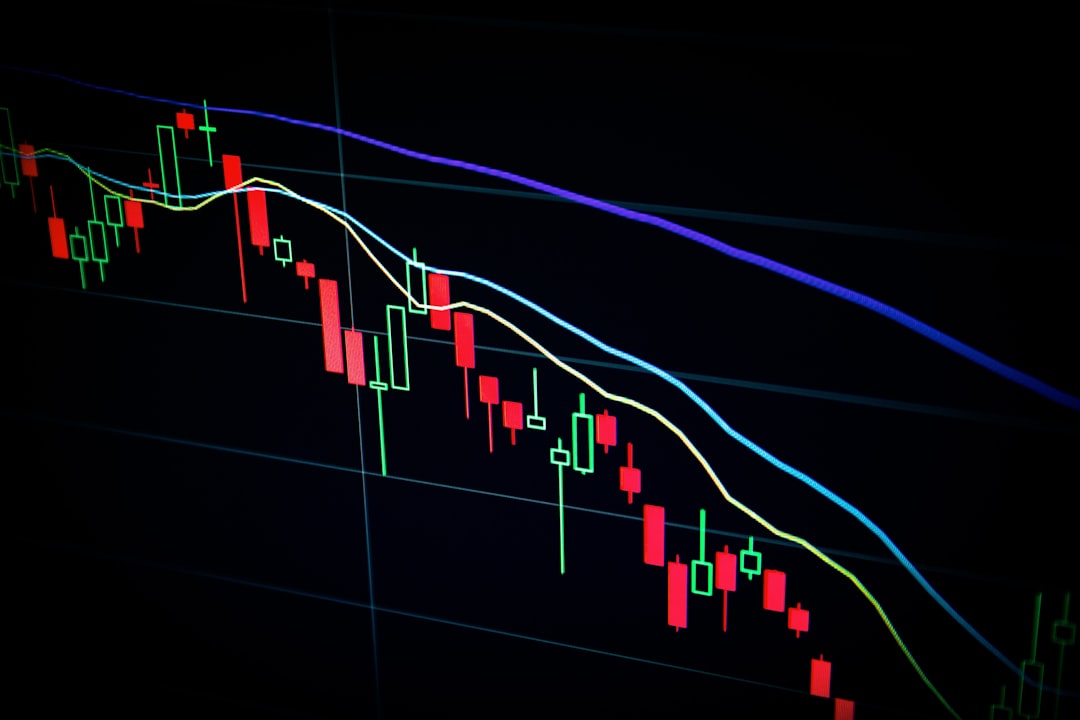
Many Forex traders struggle to predict market movements and make profitable decisions. Unlike fundamental analysis that focuses on economic news, technical analysis studies historical price data to forecast future trends. In this guide, you'll learn what technical analysis is, how it works, and why it's essential for building effective trading strategies in the Forex market.
Understanding Technical Analysis Basics
Technical analysis is a trading method that evaluates currency pairs by analyzing statistical trends from trading activity, primarily price movement and volume. Unlike fundamental analysis, which examines economic indicators and news events, technical analysis focuses solely on price charts and patterns. The core belief is that all market information—economic data, political events, and trader sentiment—is already reflected in the price.
Technical analysts use historical price data to identify patterns and trends that may repeat in the future. This approach assumes that market psychology and human behavior create identifiable patterns over time. By studying these patterns, traders aim to determine optimal entry and exit points for their trades.
Key Components of Technical Analysis
Technical analysis relies on several essential tools and concepts that help traders interpret market data. Understanding these components is crucial for developing a systematic trading approach.
| Component | Purpose | Common Examples |
|---|---|---|
| Price Charts | Visual representation of price movements | Candlestick, Line, Bar charts |
| Technical Indicators | Mathematical calculations based on price/volume | Moving Averages, RSI, MACD |
| Chart Patterns | Recognizable formations that suggest future direction | Head and Shoulders, Triangles, Flags |
| Support/Resistance | Price levels where trends pause or reverse | Horizontal lines, Trendlines |
The most fundamental concept in technical analysis is trend identification. Traders classify trends as uptrends (higher highs and higher lows), downtrends (lower highs and lower lows), or sideways ranges. Recognizing the current trend helps traders align their positions with market momentum.
Popular Technical Indicators Explained
Technical indicators are mathematical calculations applied to price and volume data. They help traders confirm trends, identify potential reversals, and generate trading signals. Indicators fall into several categories:
- Trend Indicators: Moving Averages (MA), Moving Average Convergence Divergence (MACD), and Average Directional Index (ADX) help identify trend direction and strength
- Momentum Indicators: Relative Strength Index (RSI) and Stochastic Oscillator measure the speed of price changes to detect overbought or oversold conditions
- Volatility Indicators: Bollinger Bands and Average True Range (ATR) assess market volatility and potential breakout opportunities
- Volume Indicators: On-Balance Volume (OBV) analyzes volume flow to confirm price trends
Most successful traders combine multiple indicators to create a comprehensive analysis system. However, beginners should start with one or two simple indicators to avoid analysis paralysis and conflicting signals.
Advantages and Limitations of Technical Analysis
Technical analysis offers several benefits for Forex traders. It provides objective, data-driven insights that remove emotional bias from trading decisions. The method works across all timeframes, from scalping to long-term investing, and can be applied to any currency pair. Charts and patterns also offer visual clarity, making complex market data easier to interpret.
However, technical analysis has limitations. Past performance doesn't guarantee future results, and patterns can fail unexpectedly. Major news events and fundamental factors can override technical signals, causing sudden price reversals. Additionally, different traders may interpret the same chart differently, leading to subjective conclusions. For Iranian traders interested in international Forex markets, combining technical analysis with fundamental awareness creates a more balanced trading approach.
Getting Started with Technical Analysis
Begin your technical analysis journey by learning to read basic price charts. Most trading platforms offer free charting tools with popular indicators built in. Start by identifying simple support and resistance levels, then gradually add one or two indicators like Moving Averages or RSI. Practice on a demo account before risking real capital.
Focus on understanding price action—how prices move and interact with key levels—before relying heavily on indicators. Many successful traders use minimal indicators and prioritize clean chart reading. Remember that technical analysis is a skill developed over time through practice, study, and market observation.
Conclusion: Technical analysis is a powerful tool for Forex traders seeking to understand market behavior through price patterns and indicators. By learning chart reading, key technical concepts, and combining them with sound risk management, you can develop a systematic approach to trading. Start simple, practice consistently, and continuously refine your technical skills to improve your trading decisions.